A while ago I had to take a hearing test at the doctor. The result of my left ear was unfortunately sobering, yet I found the measurement itself very interesting. To be able to continue to control my hearing ability, I wrote a program to measure the hearing threshold at different frequencies.
The way the program works is actually very simple. Tones with different frequencies are played in random order. The tones get louder and louder until the user presses a key. Meanwhile, the measuring point of the respective frequency moves downwards in the graph. Qualitatively, a louder tone corresponds to a measuring point further down in the graph. If a key is pressed by the user, the current position of the measuring point is saved. All tones, each for the left and right ear, are played until the graph is complete.
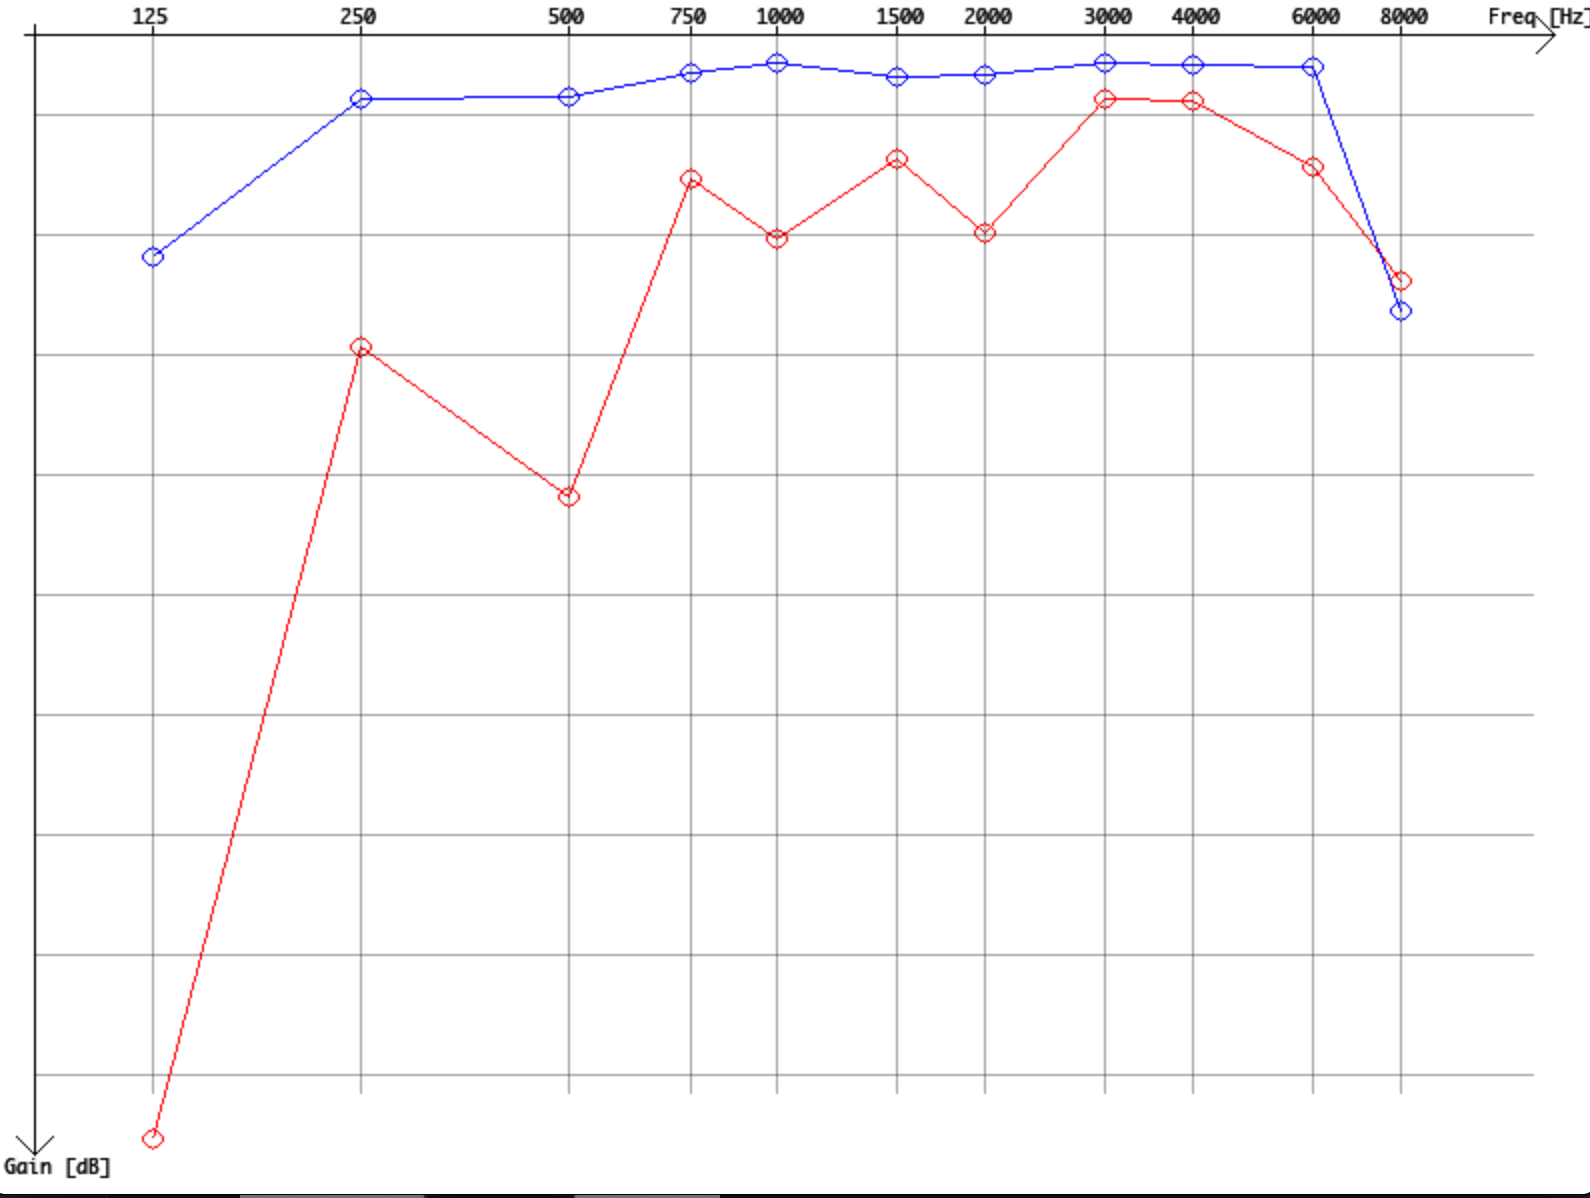
The following picture shows an example of a measurement (not an actual measurement). One can see the red line for the left ear and the blue line for the right ear. In this example, the hearing ability of the left ear is severely limited for low frequencies.
Of course, this program should not replace a real hearing test at the doctor’s office. It is also extremely difficult to calibrate the y-axis, which is why it has no scale in the current program. Nevertheless, the program can be used to qualitatively control the hearing ability over time. However, the boundary conditions of the measurement must then always be the same.
Since the y-axis does not have a scale, no absolute statements can be made about the hearing ability at a specific frequency. Nevertheless, comparisons can be made between the left and right ear.
The program can be downloaded from https://github.com/MKesenheimer/Audiometry. For the program to compile, the SDL library must be installed.
